Barr Lake shares a rich history in Colorado and has seen many  evolutions in the last 130 years. Today, it is known state-wide as one of the best birding landscapes with over 370 bird species identified. If you’ve ever flown into or out of Denver International Airport you would likely capture a glimpse of the three-square mile body of water. At 1,900 acres, Barr Lake comprises seventy percent of the 2,700-acre State Park. Located 27 miles north of Denver in Brighton, Colorado, Barr Lake is used
today for irrigation, drinking water, and recreation. Major recreational activities include hunting, fishing, birding, biking, hiking, picnicking, and nature studies.
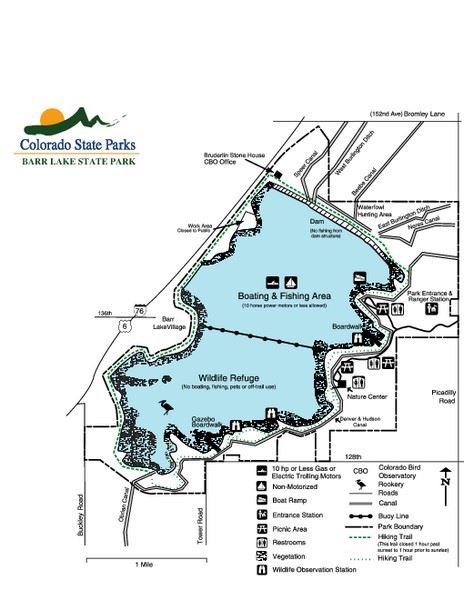
Barr Lake is approximately nine miles around with depths near thirty-five feet. At 2.7 miles long and 1.7 miles wide, much of the southern periphery maintains wallows and flooded cottonwood trees. The lake is divided in half with the north-side dedicated as a recreational area and the south-side designated as a wildlife refuge. The lake is fed by the South Platte River. Barr Lake feeds several canals to support irrigation for agriculture in the surrounding area, the most notable are the Denver and Hudson Canals. Milton reservoir is located north of Hudson and is also fed by the South Platte River. There is a ditch, Beebe Canal, that connects Barr Lake to Milton Reservoir.
Before it was a lake, the area was an extensive wallow. The area was lush with vegetation and supported migrating species. Since the Ice-Age, millions of free-ranging bison migrated through these areas. It wasn’t until 1876 during the American westward expansion that their numbers were nearly eradicated. During this time, cowboys rounded up Spanish steer and drove them along the Goodnight-Loving Trail from Texas to Wyoming through the wallows.
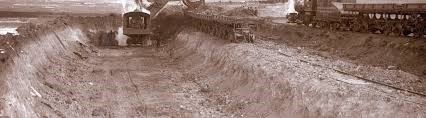
Construction of the Denver-Hudson Canal
The railroads accelerated western expansion and transformed the western landscape into opportunities and dreams. The Barr Depot was established in 1881 bringing settlers, tourists, and entrepreneurs. In 1891, the Denver Reservoir and Irrigation Company inundated the wallows from the South Platte River to create Oasis Reservoir. The newly formed reservoir attracted the affluent from Denver. In 1896, the Oasis Hunting Club was formed and offered “city-dwellers the opportunity to rusticate in the great outdoors.” With great expectations developers tried to create Barr City. However, with the closure of the railroad depot in 1931, a second city for Denver never came to fruition.
Barr Lake was officially created to meet the increasing water demands for a rapidly growing state, the Farmer’s Reservoir and Irrigation Company (FRICO) inundated the reservoir for the second time in 1908. It was boasted the reservoir could irrigate 25,000 acres annually.
Due to seventy years of abuse and diversion of waste water from the South Platte River, the Denver Stockyards, and the sewage treatment plant, Barr Lake needed another transformation. In 1964, the Colorado legislature proclaimed Barr Lake a “menace to health, safety and welfare.” The same year, Metro Wastewater was upgraded and relocated to its current location on York Street. To protect the natural resources, Barr Lake became a state park in 1977.
“On June 16, 1965, a powerful storm swelled the waters of the South Platte. Raging water rushed down the irrigation canals and into Barr Lake, effectively flushing the sewage from the lake. This natural disaster afforded Barr Lake a chance for renewal. Recognizing the need to prevent pollution of this revitalized landscape, Colorado State Parks created Barr lake State Park in 1977. Then, as now, it is preserved as ‘an island of habitat in a sea of urban development.’” (quote taken form Barr Lake State Park pamphlet)

Birding at Barr Lake
Barr Lake is co-managed for irrigation/drinking water and recreation. The reservoir is overseen by FRICO and the Denver-Hudson Canal is overseen by the Henrylyn Irrigation District. Each company owns and operates the respective land and water within. Water quality monitoring is conducted regularly by Barr Lake & Milton Reservoir Watershed Association.
Barr Lake Timeline
(provided by Barr Lake & Milton Reservoir Watershed Association, 2007)
1890’s –Oasis Reservoir used for Recreation & Irrigation
1900’s –Doubled in Size and Renamed by FRICO
1950’s –Water Quality at its Worst
1964 –Metro Wastewater Upgraded and Relocated
1978 –Barr Lake State Park & Wildlife Refuge
1994 –FRICO Started Monitoring Regularly
2002 –303(d) Listed for High pH
2004 –Domestic Water Supply Use Added
2006 –20th Year for Nesting Bald Eagles
2016 –Awarded People's Choice "2016 Business of the Year" by Brighton Chamber of Commerce
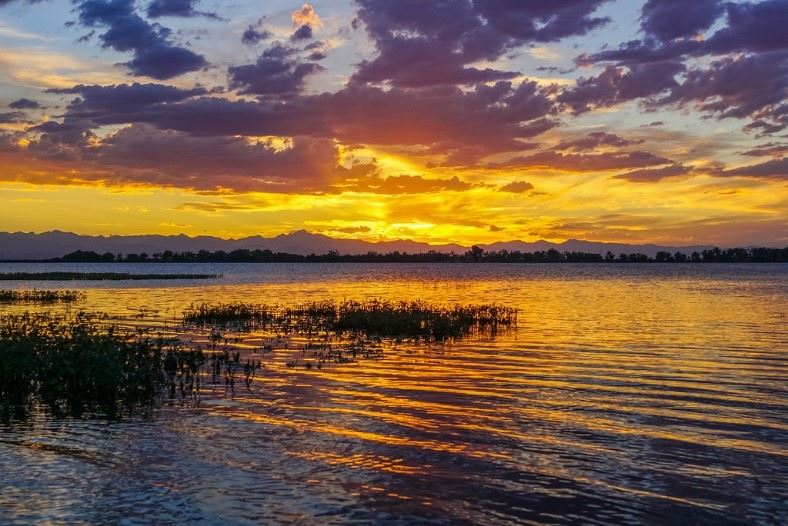
Sunset at Barr Lake by Bernie Ernie Jr.
Gerald Gaper earned a masters and doctoral degree in Analytical Chemistry from the University of Illinois at Chicago. With fourteen years of laboratory experience, Gerald’s early focus utilized analytical instrumentation to identify and characterize chemical compounds in water, bacteria, and on surfaces. Gerald worked on a variety of research projects for the pharmaceutical and academic sector, including Colorado State University. Over the last four years Gerald served the Denver Zoological Foundation as a Chemical Process Engineer and a Water Systems Manager overseeing the operations of pump stations and small water treatment facilities. Gerald managed the operations of a water quality laboratory while creating a development program for employees and an operational framework for the department.
Gerald lives next to the open space in Westminster and enjoys spending time with his wife and three dogs. In his free time, he works on a 1972 F250 Highboy 4x4 truck and volunteers in the local community. He serves as a volunteer designing exhibits for the Evergreen Autobahn Society, garbage cleanup of waterways for the City of Westminster Open Space, dog walker for City of Aurora Animal Shelter, and photographer for the Kawasaki Kids Foundation. He is the Vice President of Education for Toastmaster International, Lafayette Chapter. Gerald serves as a member of the RMWQAA Education Subcommittee designing presentations and writing newsletters.
