Welcome to the RMWQAA Website! 

Monthly Blog

Check our Blog page regularly for continually changing info, articles, news, and more!

  • 25 Aug 2021 9:42 PM | Natalie Love (Administrator)

    After studying fire ecology, I decided to abandon pre-med to pursue a career in Ecology. I never knew there were species of plants that needed forest fires for their seeds to germinate. I learned that a truly healthy forest is often only possible after the clearing of undergrowth from fire. Fascinating facts of fire ecology drive home the importance of fire. But the drying out of once-wet places (i.e the Pacific Northwest) combined with human encroachment have resulted in devastation. In many paces this is becoming the norm. Fires are more intense and spread larger than ever due in part to years of fire suppression. In Colorado we’ve had a wetter than usual start to 2021. I was curious about the forecast for our regional fire season.


    Before I dive into the data, I want to say that this was a “quick and dirty” search. I make a lot of generalizations and recognize that there isn’t always a perfect comparison between location and precipitation/fires. To keep it broad, I started by googling current fires in Colorado and found a map showing all 2021 fires. I overlaid it with a precipitation map showing 2021 rainfall (Figure 1). I was curious whether areas where fires occurred were drier than the rest of the state.


    Figure 1: Map of Colorado precipitation from January 1, 2021 through August 13, 2021 overlaid with Colorado’s 2021 fires from Coloradoan.com. The numbers correspond with the numbers in Table 1.


    The largest of the fires in Colorado this year was the June Oil Springs Fire which burned near the Utah border (Figure 1, #4). Based on the precipitation map, there were numerous green dots indicating less rainfall relatively close to the fire. The Western Slope clearly did not get as much rainfall as the mountains and Front Range early in 2021.


    The second largest fire in Colorado this year was the Morgan Creek Fire outside of Steamboat Springs in the Northeast-Central part of the state. Nearby precipitation totals were a lot higher than the Grand Junction area with some red dots indicating high rainfall relatively close the location of the fire. I had a hard time finding an update on the Morgan Creek fire. As of a few weeks ago, it was only 24% contained. Hopefully the higher precipitation is helping control that fire. Two very small fires also occurred in the southwest portion of the state where rainfall was moderate (Figure 1, #’s 6 and 7).  


    2020 was one of the most devastating wildfire years in Colorado history. I wanted to compare the 2020 fire season to 2021’s fire season. I tracked down monthly precipitation data for August 2019 through July 2020 and August 2020 through July 2021 for four different locations, 1) the Denver area, where tons of spring rain forced the cancellation of many of my kid’s soccer practices, 2) the Yampa weather station which is relatively close to the 2021 Morgan Creek Fire, 3) the Grand Lake Station which was relatively close to the extremely destructive 2020 Cameron Peak Fire (Colorado’s Largest in history) and East Troublesome Fire which burned a combined 402,725 acres or 520 square miles (9News 2021), and finally, 4) a weather station in Grand Junction which is close to 2020’s third largest fire, Pine Gulch which burned 139,007 acres and is also relatively close to the 2021 Oil Springs Fire.


    There are a few things that are apparent from these figures (Figures 2-5), 1) Denver received much more rain in early 2021 than any of the other three sites graphed. 2) Grand Junction was particularly dry in the graphed timeframe which explains the fires in both years. 3) The Grand Lake dataset is fairly interesting. February 2020 saw a relatively high amount of precipitation. While months leading up to the Cameron Peak and East Troublesome Fires were by no means wet, there was still some decent rainfall which would make you think that the extreme fires that occurred should not have been as bad as they were. However, none of the data tell the full picture on the rainfall patterns (all at once vs spread over time), which might help explain the extreme fire situation. The beetle kill was also a particularly destructive component of the 2020 fires.


    Figures 2-5: Monthly precipitation for four sites from August 2019 through July 2021. Data from Colorado State University's Colorado Climate Center.


    What does all this mean for the rest of the 2021 fire season? Well, based on the data I looked at, I have no idea. Clearly the Western Slope needs more rain. I turned to the experts for predictions for the rest of the fire season. According to the Predictive Services National Interagency Fire Center (who knew there was such a thing!):


    “Above normal significant fire potential is predicted in August and September across the northwest corner of Colorado through much of Wyoming, South Dakota, and northwest Nebraska.”


    “Late June and July precipitation and moderating fire weather conditions resulted in a decrease in new significant fire activity as well as reduced growth on existing large fires.”  


    “The Climate Prediction Center (CPC) outlook for August indicates drier and warmer than normal conditions over northern portions of the Rocky Mountain Area. More extensive warming and drying is projected for the autumn period, especially west of the Continental Divide.”


    Check out the link in the references to read the full story, but it appears the wetter weather is helping reduce fire risk for parts of the state, but unfortunately the rain has not been reaching the entire state leaving many areas at risk for more fires.


    When compiling the data on the fires that have occurred in 2021 in Colorado (Table 1), I was surprised to find that all were either confirmed to have been started by lighting or are being investigated but likely started by lighting. After briefly discussing wildfires in California with a colleague, I learned that more than one of those extremely destructive fires was started by transmission lines rather than natural factors. While wildfires these days are becoming more and more destructive, it is frustrating to learn that some of California’s wildfires were preventable. Despite the benefits fire brings to forests, with the spread of people deeper into the forest, fires must be minimized and controlled.


    Table 1: Colorado’s 2021 wildfires as of August 23, 2021 from Coloradoan.com.

    Name of Fire

    Location on Map

    % Contained

    Date Started

    Cause

    # Acres Burned

    Morgan Creek Fire

    1

    24 as of 8/12/21

    7/9/21

    Lightning

    7,505

    Muddy Slide Fire

    2

    70 as of 8/6/21

    6/20/21

    Lightning

    4,093

    Sylvan Fire

    3

    90 as of 8/20/21

    6/20/21

    Lightning

    3,792

    Oil Springs Fire

    4

    99 as of 7/6/21

    6/18/21

    Lightning

    12,613

    Wild Cow Fire

    5

    100 as of 6/28/21

    6/21/21

    Lightning Suspected

    560

    Trail Canyon

    6

    90 as of 6/22/21

    6/18/21

    Lightning

    881

    Vosburg Pike

    7

    100 as of 7/17/21

    6/16/21

    Under Investigation

    67


    References


    9News. https://www.9news.com/article/news/local/wildfire/colorado-2020-historic-wildfire-season/73-c9458147-c945-45e6-bea9-a1d426cca102  Accessed August 23, 2021.


    Colorado State University; Colorado Climate Center. Precipitation map and precipitation data.  https://climate.colostate.edu/  Accessed August 13, 2021.


    Coloradoan.com. Hazard Mapping System: Fire and Smoke.  https://data.coloradoan.com/fires/ Accessed August 13, 2021.


    Predictive Services National Interagency Fire Center. 2021. National Significant Wildland Fire Potential Outlook. Issued: August 1, 2021.


    Natalie Love is the Laboratory Director at GEI Consultants, Inc. GEI conducts Whole Effluent Toxicity (WET) Testing, low-level nutrient analysis, and benthic macroinvertebrate identifications. She lives in Denver with her husband, 2 daughters, and Belgian Malinois, Nacho.


  • 29 Jul 2021 8:45 AM | Natalie Love (Administrator)

    Do you ever feel like you’re in a Parks and Rec episode when dealing with resident water quality complaints?


    “There’s a sign in the park that says DO NOT DRINK the sprinkler water and I made some tea with it and now I have an infection” -Parks and Rec episode


    I got the idea for this month’s blog recently when I was asked by a resident, “Why does my washing machine smell like doo-doo water”. Easy fix, bleach and sanitize your washing machine for mold and mildew.


    It can always be tricky trying to diagnose water quality issues at a residence or business when there are multiple factors that can affect the taste and odor. As I am very confident in our water quality and take great pride in our water, I find it a fun challenge to be able to troubleshoot residents’ water quality issues and teach them about water quality and our treatment techniques. Many complaints start with water heater issues or old refrigerator filters. Yes, I’ve been asked multiple times to test resident’s ice cubes!


    If we can’t resolve a problem over the phone, we offer to test the resident’s tap water to compare any differences to our distribution lab data. Here are some of the questions to ask and ways to troubleshoot possible water quality issues to help you determine whether the issue is related to taste/odor problems from the water itself or something within the residence.

    • Make sure the water is always cold out of the kitchen tap when comparing water quality between sources; hot water chemistry can be completely different due to water heater conditions
    • Suggest annual or bi-annual water heater preventative maintenance to the resident to mitigate issues by flushing out iron and manganese sediment and keep the unit running efficiently
    • Recommend cleaning out tap diffusers, especially if new galvanized plumbing has been installed
    • Water softeners or any other separate treatment systems like reverse osmosis can cause issues if not properly maintained or cleaned regularly
    • New filters and water softener media should be flushed or seasoned when installed
    • Old refrigerator filters/water lines and scale build up on fridge water lines can cause taste and cloudiness issues
    • Clean scaling in small water lines with vinegar solution for different appliances; check out Youtube for instructions on specific brands
    • New residents to the area often have a different taste for the water and it takes time to acclimate to the taste
    • Taking new medications can alter you taste of drinking water and COVD symptoms has raised new issues with loss of taste
    • Is the glassware actually clean? Dishwasher performance or residual detergent left on glassware can create taste problems
    • Solar Water heaters on the top of the roof can also cause issues (yes, I’ve actually run across this issue)
    • If there is an odor coming from the sink, it is most likely coming from the drain and can be improved by cleaning with baking soda, vinegar, hot water, and even orange peels ground up with a garbage disposal
    • Chlorine taste/odor can be mitigated by filling a pitcher of water and storing it in the fridge overnight to allow the chlorine to dissipate out
    • Cloudiness in the water often happens with temperature fluctuation and will also dissipate within 5 minutes
    • Color issues, often an orange or black tint, are most likely iron or manganese, potentially from hot water heaters
    • Compare the outside tap water quality with the kitchen tap water quality or nearby distribution sampling site to assess the location of the problem
    • There could also potentially be a change in water quality from the change in seasons that is messing with the chemistry in the water which should pass soon
    • Lastly, are staff flushing hydrants in the area or was there a watermain break that disrupted services?

    If all else fails, have the Distribution Department flush the area to bring in fresh water and hopefully resolve the issue. There are multiple issues than can occur that could potentially cause taste and odor issues so having a few questions in your pocket to help diagnose the problem can make the resident feel at-ease and be more willing to help and hopefully figure out the issue faster. It also helps to keep an ongoing list of water complaints to help with future issues and diagnosis if certain locations or neighborhoods experience similar problems.


    I figured this blog could help staff that deal with water complaints as well as distribution samplers that are asked questions by residents while sampling throughout the community. It is always fun working and troubleshooting with the public! Keep calm and Enjoy!


    John Winterton is the Laboratory Supervisor at the City of Northglenn. He’s been working with Northglenn for over 5 years in water treatment and water quality.


  • 30 Jun 2021 1:41 PM | Natalie Love (Administrator)

    Ah Summer, (queue your favorite summer song playing in the background).  For some that means children are out of school, crowded swimming pools, garden fresh tomatoes and zucchini, and vacations especially after lockdown for over a year.  For the quality control lab at Aurora Water that means Lead and Copper season.  Yes, from June to September each year Lead and Copper are the masters of my work day. 


    The Lead and Copper Rule (LCR) is changing so this year’s sampling event is different.  Although we are still governed by the “old” rule, we want to prepare for implementation of the revisions to the rule.  This year we are essentially working both rules.  As a result, we identified a few goals to accomplish this year in relation to lead and copper sampling:

    1. Encourage increased participation under the current rule.  Many of our repeat participants are customers whose homes have copper pipe with lead solder, which will not be valid samples under the new rule but for now we are still welcoming samples from those customers.  The challenge is that many of these customers have been participating in the study for years but recently we have seen a decrease in participation.  So this year we offered an incentive for those customers to continue to participate in the study.
    2. Help our repeat customers that qualify to sample under both rules adjust to the change from sampling 1 liter to 5 liters.  We revised our sampling instructions with simplified language and included photographs of the sampling process.
    3. Identify areas that potentially have lead service lines and encourage those customers to participate in the study.  We worked with other city departments to identify which areas potentially have lead service lines and added those to our sampling pool.  We initiated a postcard campaign to reach out to these customers requesting participation and we offered an incentive to encourage participation of these new customers.  We also removed any households that are confirmed to not have lead service lines. 
    4. We determined it would be prudent to gather as much data as possible.  We do not know what to expect from these new sample sites that have not been tested before.  As we identify any potential lead lines through sampling we can work to get those service lines verified and replaced, if they are determined to be lead lines.  As GI Joe would say, “ Knowing is half the battle.”

    This seems to be working out so far.  We have about 200 customers that have agreed to collect samples this year.  We began delivering sample kits earlier this month and already have 80 samples returned.  Which is encouraging because in 2020 we only received 54 samples total.


    Once this year’s samples have been analyzed we will have a better indication of what we are facing for the future under the revised rule.  Hopefully by the time the revised rule changes are implemented we will have all the kinks worked out and have our new sampling pool in place full of customers that are ready to sample when requested.


    Happy Summer!


    Adele Rucker is the RMWQAA President and a Sr. Laboratory Analyst at the City of Aurora's Quality Control Laboratory.

  • 13 May 2021 10:59 AM | Tyler Eldridge (Administrator)

    As a water and scientific centric community, much of our focus is centered on emerging contaminants, challenges in treatment, new technologies, or whether that beer made from recycled water can really be trusted. These topics often leave me brain-drained, wondering if I will be able to retain or understand any of the information I just received. That drain is relatively easy to overcome once I get back home, get some rest, and focus on life outside of work. There is however, a lingering drain on my psyche this time of year, leaving myself and likely others, feeling pressured to make major changes at all levels when it comes to the conservation of water. Reading about droughts, water shortages, or companies taking water improperly with little to no punishment (*ahem* Nestle!) can be mentally taxing.


    I often wonder if I am doing enough to help conserve water and reduce usage in my household, while simultaneously convincing myself “there’s only so much I can do.” In fact, there is SO MUCH I can do! Lately I have found that the smallest of changes throughout my day have improved my mentality with regards to being water conscious, and I wanted to use this month’s blog to remind us of some well-known, as well as relatively unknown methods of conserving water. If I can reduce my water usage by just one gallon a day, then that means one to two days’ worth of an individual’s recommended fluid intake is available for use elsewhere, or at least not being used unnecessarily! Stringing any number of the methods below can increase that number drastically. How many measures can you add to your daily routine?


    The Obvious:

    You’ve likely heard of or implemented these steps already, but it wouldn’t be a list of water saving tips without them!


                   -Fix leaks, replace washers, limit drips: One of the best ways to reduce water use is to eliminate uncontrolled use of water. Washers are cheap, and in hoses they are simple to replace, start there if you find leaks on the way to the yard or garden. Sink faucets take a bit more time, but washers can easily be replaced (a quick google helps if you are unsure). A leak that drips just once a minute can amount to roughly a liter of water a day, but often drips occur at ten times that rate.1 

                   -Reduce shower time: One minute off your shower time can save 2.5 gallons based on the average showerhead, according to the EPA. Any amount of time you can shave off here adds up quickly!

                   ­-Install low-flow shower heads and toilets: More efficiency and less flow means less water use, easy fix here if you can install your own. If renting like myself, you can always reach out to the landlord about making these minor changes and the importance of reducing water usage. If not for you, maybe they will think about making the switch between tenants!

                   -Don’t let water run in general if not in use: This goes for all tasks water related, if it’s not actively in use, make sure the faucet is off. Brushing your teeth, washing your hands, doing the dishes, all of these involve the use of the faucet, but not the entire time. One minute of faucet use can equate to a gallon of water at an average flow setting.2


    The Less Obvious:

    Some of these may come into play on a daily basis already, but some less apparent methods for saving could be added in!


                   -Collect water for general use rather than letting it flow down the drain: Nobody wants to jump in the shower right as you turn the faucet on. If you really want to go into full water savings mode, use a bucket to collect the cold water as the shower warms up, then use it on general tasks around the house: watering plants, watering pets, rinsing dishes, cleaning in general! This can work in any scenario where you may need to run water until it reaches a desired temperature. Collect water in a pitcher to put in the fridge for cold drinking water later rather than running the faucet until it is cold (I suppose ice is a thing too…)

                   -Drink tap water over bottled: Aside from the impact plastic has on the environment, it also takes at least twice as much water to make a plastic bottle than then bottle can hold. Reusable bottles or cups all the way!3 

                   -Defrost food ahead of time in the fridge: Rather than setting the food in water, or running water over it to defrost.

                   -Use the garbage disposal less frequently: Scrape food waste off into the trash as much as possible, disposals require running water to be effective. This can also reduce the time required to rinse off dishes in general.

                   -Wash dishes and laundry in full loads: Math would dictate that 2 large loads of laundry uses less water than 3 medium loads. I can always count on finding random clothes or hand towels that can fill up a load if I really need to get a smaller set of clothes washed!

                   -Find efficiency in the garden: I could create a whole blog on garden efficiency itself! There are plenty of venues to save water here:4 

    • Mulch around plants to allow for less evaporation of water
    • Water locally near the base of the plant
    • Don’t water if the soil is still visibly wet
    • Use drip irrigation if possible
    • Collect water for outdoor use during rain events – Most areas in Colorado now allow for the collection of up to 110 gallons of rain water to use on the lawn or garden.5 Or use that water collected from the methods above!
    • Water in ground plants in the morning to reduce evaporation
    • Plant native vegetation where possible, they are used to our arid climate
    • Mow the lawn higher and with sharp blades, both can reduce water use of lawns
    • Install timers, forgetting a running sprinkler is great for the lawn in the short term, but terrible for water conservation all around (guilty as charged..) They can also be delayed, or sense rain events to reduce unnecessary watering

    The Unknown or “Life Changers”:

    These methods are further removed from water itself and may require a good deal of work to implement on your own and as a population. Producers will produce so long as customers continue to use their products, so it takes a large group of individuals making adjustments over time to see real change, but it can be done! Props to those of you who may already be participating in the following:


                   -Eat less meat: Some of you reading this have likely already taken this route, so you are well ahead of my water saving footprint! Meat products require water use in keeping the animals alive directly with water, as well as growing their food source. Fruits and veggies cut out the middle man (middle cow?) and only require a water source and some TLC. Even substituting a beef meal with a chicken meal can provide a major reduction in water usage! Denver Water helps highlight the differences in water usage among food sources in this article. 
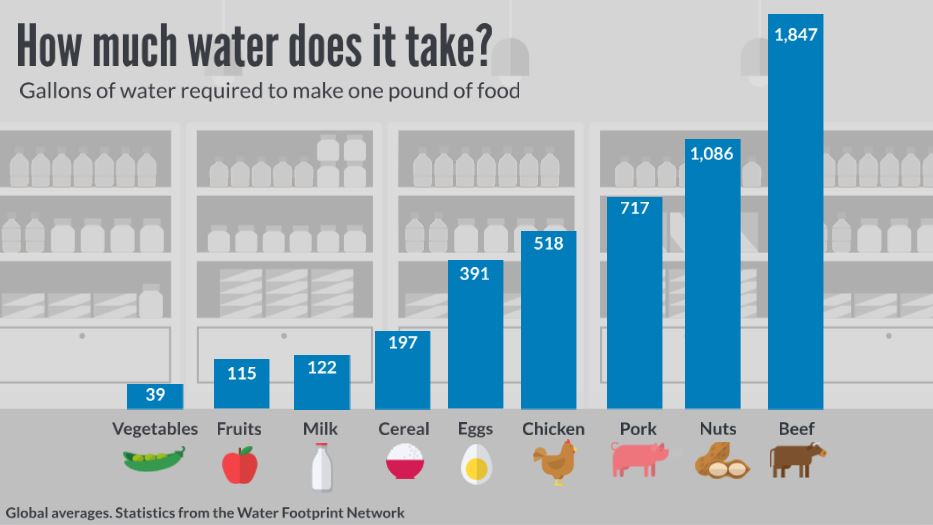

    Food water footprint


           -Drive less when possible: It requires roughly 2.5 gallons of water to refine a single gallon of gas. Why not combine climate benefits with water resource benefits and walk or bike to those nearby locations instead? If nothing else, do your best to avoid hoarding gasoline in general… https://www.cbsnews.com/news/gas-shortage-panic-colonial-pipeline-cyberattack/

                   -Opt in to Xeriscape Rebate Programs: A number of cities across the state offer programs that help rebate or mitigate the cost of replacing water guzzling lawns. Greeley, for example, will rebate $1 per square foot of bluegrass turf removed and replaced up to 2000 square feet! Obviously there are some stipulations and applications involved, but it is possible to receive money, use less water, and reduce time spent mowing every week. Check in with your City to see if they have similar options, and if not, reach out to City Council to see if they have plans or are interested in creating a similar program!


    This is by no means a comprehensive list, so feel free to find methods that fit with your lifestyle. Even implementing just one of the above tips into your daily routine can make an impact on water usage, and leave you feeling happy with the effort you’ve made!


    References:

    1. https://water.usgs.gov/edu/activity-drip.html

    2. https://www.greenamerica.org/save65gallons

    3. https://www.watercalculator.org/footprint/the-hidden-water-in-everyday-products/

    4. https://www.hgtv.com/outdoors/gardens/planting-and-maintenance/25-ways-to-conserve-water-in-your-garden-pictures

    5. https://extension.colostate.edu/topic-areas/natural-resources/rainwater-collection-colorado-6-707/


    *Tyler Eldridge is the Data and Asset Manager for the City of Greeley's Wastewater Treatment and Reclamation Facility, he also helps maintain the website and memberships for the RMWQAA.
  • 20 Apr 2021 2:29 PM | Natalie Love (Administrator)

    If you work in the water or wastewater field you have probably heard a lot lately about per- and polyfluoroalkyl substances (PFAS). So what is PFAS? It is a group of man-made chemicals that have been manufactured and used throughout the world, including the US since the 1940s, and are found in many consumer products such as microwave popcorn bags, pizza boxes, fast food wrappers, shampoo, dental floss, stain repellents, and non-stick cookware. PFAS manufacturing and processing facilities, airports, and military installations that use firefighting foams are some of the main sources of PFAS. PFAS may be released into the air, soil, and water, including sources of drinking water. Scientists call them “forever chemicals'' because their chemistry keeps them from breaking down under typical environmental conditions.


    The two main PFAS chemicals that we hear a lot about are: perfluorooctanoic acid (PFOA) which is used in the process of making Teflon and perfluorooctanesulfonic acid (PFOS) which was the key ingredient in Scotchgard, a fabric protector made by 3M, and numerous stain repellents. I can remember having my carpets professionally cleaned and being offered (at an additional charge of course) the application of Scotchgard. This would make my carpet repel and block stains and with three kids why wouldn’t I want it!? It sounded like a miracle product.


    So, why are PFAS important?  There is evidence that exposure to PFAS can lead to adverse health outcomes in humans. The most consistent findings include higher cholesterol rates. Some studies have also noted low infant birth weights, effects on the immune system, cancer (PFOA), and thyroid hormone disruption (PFOS). In May 2016, the Environmental Protection Agency (EPA) released a revised lifetime health advisory of 70 ng/L for individual, or combined, PFOA and PFOS concentrations. This is a health advisory, not a standard. Certain PFAS can accumulate and stay in the human body for long periods of time.


    What does this mean for drinking water and wastewater facilities? Currently, PFAS chemicals aren’t regulated in Colorado and the EPA hasn’t established drinking water regulations yet. However, many drinking water facilities participated in the 2020 Colorado Department of Public Health and the Environment’s free testing program that was offered to public drinking water systems serving communities, schools, and workplaces and also to fire districts with wells. This project tested for PFAS throughout the state in treated drinking water from public water systems, groundwater and surface water sources used for drinking water, and wells serving fire districts. The results can be found here


    On March 11, 2021, the EPA published the proposed fifth Unregulated Contaminant Monitoring Rule (UCMR 5). UCMR 5, as proposed, would require drinking water facilities to sample for 30 chemical contaminants between 2023 and 2025. These chemicals include 29 PFAS and lithium. EPA is currently accepting public comment on the proposed UCMR 5. Labs will be able to use either of two EPA validated analytical methods for potable (drinking) waters (Methods 533 and 537.1).


    As for wastewater,  the Water Quality Control Commission’s Policy 20-1 was approved in July 2020. The policy provides guidance on how to implement permit conditions for per- and polyfluoroalkyl substances under the existing narrative standard. The policy also sets values for a subset of PFAS, called translation levels. These translation levels may be used to implement permit effluent limits for PFAS in Colorado Discharge Permit System permits and to develop Colorado’s impaired waters list. However, there are currently no analytical methods for analyzing PFAS in wastewaters (non-potable) that are approved for Clean Water Act monitoring per 40 Code of Federal Regulations (CFR) Part 136 (Appendix B). Despite the fact that there are no analytical methods, monitoring for these parameters made it into the first Colorado permit on March 31, 2021.


    So what can we expect in the future? On November 22, 2020, the EPA released a memo that describes recommendations for an interim Federal NPDES permitting strategy for PFAS. The memo was developed by an internal workgroup, in which all EPA regions were represented. The memo presented three primary recommendations:


    1. The inclusion of PFAS in the National Pollutant Discharge Elimination System (NPDES) permit monitoring requirements, using a phased-in approach to account for ongoing EPA analytical method development.
    2. Stormwater monitoring and pollutant control for municipal and industrial stormwater permits, addressing PFAS using traditional controls such as control measures, monitoring, stormwater pollution prevention plans (SWPPPs)
    3. Information sharing, using established platforms, such as a PFAS-permitting compendium on the EPA’s NPDES Municipal Sources Resources website, and information sharing on the EPA’s NPDES Permit Writers’ Clearinghouse.


    Structure of PFOA


    Lesa Julian has worked for the City and County of Broomfield for 30 years.  She is currently the Environmental Services Superintendent.

  • 22 Mar 2021 10:22 PM | Natalie Love (Administrator)

    The Mpemba effect is the curious phenomenon that hot water can freeze faster than cold water. Consider that! A container of hot water, identical in all other aspects except temperature to another container of water, can freeze before the cooler water. Surprised? Confused? You are not alone! The question of whether this is real or not has been discussed for over 2300 years.


    The Mpemba effect is named after Erasto Mpemba. As a high school student in Tanzania, he re-invigorated the scientific discussion about this effect, along with a professor that worked with him. Mpemba was making ice cream by boiling milk and adding sugar, then freezing it. He noticed that the boiling hot mixture that he put into a freezer formed into ice cream faster than a cooler similar milk and sugar mixture that a fellow student had added to the freezer. (I think it is important that this fascinating effect was elevated in scientific circles through making ice cream faster than your friends.) At first Mpemba was more mocked than believed for his assertion, but through dogged determination Mpemba got a professor interested, and a series of university experiments supported Mpemba’s observation. Mpemba and the professor, Dr. Osborne, put out a paper together in 1969 entitled simply “Cool?” This increased scientific interest in this odd cooling effect.


    Mpemba was one in a long line of people looking into this effect. It had been noticed by none other than Aristotle in the 300s BC. Aristotle wrote that “The fact that water has previously been warmed contributes to its freezing quickly…” and implied that this was well known (if not well understood) by saying that “Many people, when they want to cool water quickly begin by putting it in the sun”. Aristotle was unable to empirically prove, or even put forth a reasonable mechanism for this effect.


    In the 1200s, Roger Bacon, an English philosopher and scientist, experimented with this then-called ‘hot begets cold quicker’ phenomenon without resolution.  In the 1400s (now 1700 years after Aristotle), the Italian physicist, doctor, and mathematician Giovanni Marliani is said to have the first empirical proof of this effect, although the reasons why were not understood. Francis Bacon wrote about hot water freezing quicker than cool water in 1620 in his “Novum Organum Vol VIII”, as did Rene’ Descartes in his 1637 “Les Meteores”. Over three hundred years later when Mpemba revived interest in this effect it was still not understood.


    After Mpemba reinvigorated discussion about this effect there was of course considerable doubt in the scientific community. And why not? The very idea of it seems to contradict or at least skirt basic rules of thermodynamics. The fact that the mechanism could not be explained, and that the Mpemba effect only worked (if it indeed did work) in certain circumstances and seemingly none of the experiments were able to isolate all other factors or be reproducible also cast doubt.


    Forty some years after the publication of “Cool?”, there was still controversy. In 2012 Britain’s Royal Society of Chemistry had a worldwide competition to find the best explanation of the Mpemba effect. It had 22,000 submissions (including one from the author). The winning submission (not this author’s) focused on four possible reasons for the effect. While none are proven to be the single reason for the effect, some think that a combination of these four plus an additional fifth possible reason known as “Super cooling” might account for the effect. Others deny still that the effect exists and point to some experiments showing this.


    Here are the explanations put forth for the Mpemba effect:

    1. Evaporation – hotter water evaporates more. Evaporation itself is a cooling effect, besides which hot water would have less mass to cool due to evaporation.
    2. Dissolved gasses – hot water contains less dissolved gasses (and boiling water removes almost all gasses). Less gasses could change the ability of the water to conduct heat, could reduce thermal insulation in the water, or could change the freezing point of the water.
    3. Convection – hot water will have greater temperature gradients and as water density is a product of temperature the cooling effect of convection currents from temperature gradients will affect the total cooling of the water.
    4. Surroundings – the theory that hot water somehow affects the surrounding of its container in such a way that facilitates quicker cooling. For example, a container of hot water might melt ice that the container is on, increasing physical contact between the container and the ice, which would assist cooling.
    5. Supercooling – the idea that cooler water would possibly need to supercool below 0 degrees C in order to actually freeze. This idea also incorporates the idea that a nucleation site might be needed in the cooler water in order to form ice crystals, while something called temperature shear in non-thermally homogenous cooling hot water would cause freezing closer to 0 degrees C for hot water.

    This is all just fascinating to me! The Mpemba effect to date has neither been totally disproved or proved. As they say, “We can put a human on the moon, but we still don’t know if cold water freezes before hot water.” Also, a great learning subtext to this story is that a young student put forth a proposition that seems preposterous, but that may be true. It is a lesson in keeping an open mind and not dismissing different ideas out of hand.


    What do you think? Could the Mpemba effect be true? Would it defy accepted laws of thermodynamics? Could it be the key to other learning? Or maybe more importantly, would it change how you make ice cubes at home? (We tried to test this several times in our freezer, but our experimental plan failed every time due to “Look – squirrel!”. However, my wife and I do agree that boiled water makes much prettier ice cubes).


    Thanks!


    Richard MacAlpine


    Richard is a Lab Supervisor at Metro Wastewater Reclamation District in Denver. His opinions and any facts presented in this blog are his responsibility solely and do not reflect at all on his employer. Richard is also the RMWEA Lab Practices (LPC) Committee Chair and is on the RMWQAA Board.


    Resources:

    https://math.ucr.edu/home/baez/physics/General/hot_water.html More detail on the five main mechanisms considered to cause the Mpemba effect


    https://edu.rsc.org/download?ac=13093 Copy of Erasto Mpemba and Dr. Osborne’s 1969 paper “Cool?” in Physics Education, 1969


    https://www.nytimes.com/2008/03/18/health/18real.html A quick article arguing that while the Mpemba effect is real, its obverse (cold water boiling faster than hot water) is not


    https://www.nature.com/articles/srep37665#:~:text=The%20Mpemba%20effect%20is%20the,to%20the%20writings%20of%20Aristotle. Nature article arguing against the Mpemba effect


    http://www.eoht.info/page/Aristotle-Mpemba%20effect  Brief history of the Mpemba effect, general info, and how the Mpemba effect may apply to the Cold War (the social Mpemba effect).


    https://www.rsc.org/news-events/articles/2012/06-june/rsc-offers-1000-for-explanation-of-an-unsolved-legendary-phenomenon/ Royal Society of Chemistry Mpemba effect competition from 2012 (which again, the author did not win), and other info


    https://en.wikipedia.org/wiki/Giovanni_Marliani#cite_note-Hot_water_freezes_faster_than_cold_water-1  Marliani’s supposed empirical proof of the Mpemba effect, and his inability to ascribe a mechanism to it


    http://www.eoht.info/page/Roger%20Bacon Info on Roger Bacon, who was called the first scientist, was the originator of the scientific method, and one in a line of people who did not solve the Mpemba effect


  • 26 Feb 2021 10:14 PM | Natalie Love (Administrator)

    South Platte Sally came to help out in 2020 quarantine times after traveling throughout the US and overseas. As many folks, Sally came home to be close to family and friends and help those from her home state of Colorado.  Along with several degrees in Fisheries Science, Biology, City Planning, and Psychology, Sally has worked in various labs and performed field work across the country.  Due to her unique DNA, Sally is immune to Covid-19, which makes her the perfect volunteer.  She is also lucky enough to be independently wealthy due to her family’s successful line of toys.  She only volunteers and never takes a paycheck. Maybe that’s why she always has a smile on her face. 


    Her recent work on the South Platte River has been full of adventure.  She started with a season of electroshocking last Fall. Sally was able to score a prize-winning green sunfish at 72mm and 5g.  Of course, she is a fan of catch and release.  Other skills in her bag include sampling and analysis of rivers, lakes, and groundwater.  Sally assisted in a recent invasive aquatic plant survey and study, but results are still pending.  In the lab she’s working with other chemists to develop PFAS methodology. 


    Look for future posts from Sally about all field and lab related topics.


    Michelle Neilson, Water Quality Scientist, has been with Metro Wastewater for over 12 years.  She has a B.S. in Chemistry, and has 23 years of experience in the Environmental field.  Michelle has worked for USGS, contract laboratories, and several municipal wastewater and drinking water labs prior to Metro Wastewater. 

  • 30 Jan 2021 8:52 AM | Natalie Love (Administrator)

    Besides popping a bottle of champagne with friends, staying up until midnight dancing the night away, and watching the count down to the ball drop in Times Square in anticipation of a kiss or a hug from that special so and so……wait, let me re-phrase, it was the end of 2020 after all.  Besides drinking a bottle of wine by yourself, watching the Twilight Zone marathon, then falling asleep on the couch at 9:30 pm, another tradition that comes with a new year is the procrastination of a half-hearted attempt at coming up with personal goals to improve the essential aspects of daily life, or the new years resolution. Research has shown that 50% of adults in the U.S. make New Year's resolutions, but fewer than 10% actually keep them for more than a few months (1). But come on people its 2021!  We can do better than that! Below are a few links to help you keep on track with your new years resolutions!


    https://www.forbes.com/sites/kathycaprino/2019/12/21/the-top-3-reasons-new-years-resolutions-fail-and-how-yours-can-succeed/?sh=3bab1c196992


    https://www.verywellmind.com/how-to-keep-your-new-years-resolutions-2795719


    https://www.health.harvard.edu/staying-healthy/seven-steps-for-making-your-new-years-resolutions-stick


    https://www.nytimes.com/guides/smarterliving/resolution-ideas


    References

    1: https://www.westernconnecticuthealthnetwork.org/newsroom/article-listing/new-years-resolutions#:~:text=re%20not%20alone.-,Research%20shows%20that%20as%20many%20as%2050%20percent%20of%20adults,from%20the%20COVID%2D19%20pandemic.


    Ashley Romero is the Laboratory Manager at GEI Consultants, Inc. and has a background in ecotoxicology.


  • 30 Dec 2020 8:58 AM | Natalie Love (Administrator)

    Whether you wear prescription glasses, safety glasses, or sunglasses, you're sure to notice the imminent fog caused by the required masks. This fog can be annoying and downright dangerous, and it is only going to get worse as the temperatures continue to decrease. Because I am blind without my glasses and rely on my mask for COVID-19 protection, I decided to research to find a way to make these two necessities work together.


    Let's discuss why your glasses fog up in the first place. As you exhale, the water molecules in your breath hit your face mask. Depending on how porous the material is, some will penetrate, some will be absorbed, and most will be directed to the path of least resistance - typically the space at the top between your mask and cheeks. Because your glasses are colder than the air inside your mask, your breath will condensate on them, causing the annoying fog.


    One way to keep your glasses from fogging up is to ensure that your mask fits properly with an adjustable noseband. If your mask does not have a noseband, you can always make one out of pipe cleaners and secure it to the top of your mask. After trying several different types of masks with built-in nosebands, it still allows for some air to come through and fog your glasses. The noseband helps but is not the best solution.


    A method that works well with some of the masks I own is using your glasses to seal the top of the mask. If you pull your mask up higher on the bridge of your nose, you can set your glasses on your mask, ensuring that there is no gap for your breath to escape. I have found that some mask material allows my glasses to slide down my nose, and other masks create a gap between my chin and mask when I pull it up for this method. It works in a pinch, but there has to be a better way!


    Healthcare workers insist that their secret for fogging glasses is using soap and water. When they wash their hands, they also give their glasses a lather and rinse. The soap is supposed to leave a film on the glasses that keeps them from fogging up. I tried with a mild hand soap first then moved onto dishwasher soap, both with no avail. Maybe the healthcare workers have a stronger detergent that works better for the anti-fogging, but as far as I have seen, the soap and water do not provide any added benefit.


    Mask extenders claim to help with the fogging issue by linking the ear loops of your mask on the back of your head, providing a tighter fit of your mask on your face. Not only are mask extenders more comfortable for your ears, they narrow the space where your breath typically escapes between your mask and cheeks. You can buy these online, ask your bored mother to knit you one, or even improvise with some paper clips. Using the mask extenders with a mask that has an adjustable noseband will give you the best results. When trying this method, I only had fogging when I exhaled really big breaths, so this could be a reasonable solution to the fogging issue.


    Using a tissue to block the space between your cheeks and mask was mentioned on Facebook as a fogging solution. I folded a tissue neatly and placed it along the top of my mask. It took some trial and error to get it right without blocking my nostrils. The space was minimized along with the fogging, but the tissue did get damp over time. I suggest if you use this method, replace your tissue often!


    Dr. Daniel Heiferman, a neurosurgeon in Memphis, tweeted a tip that he uses in the operating room to keep his loupes from fogging during surgery. A BANDAID! He realized that a bandaid placed on the bridge of the nose eliminated the fogging and provided protection against irritation. Simply secure the bandaid with the cotton part on the bridge of your nose, with half the sticky part on the mask and the other half on your face. This completely eradicates the gap between your face and the mask, which shifts the escaping air to a different gap, eliminating fogging completely! The bandaid is also textured enough to prevent your glasses from sliding down the bridge of your nose. After trying all the other methods, this is the one that I recommend!


    There are some other suggestions out there that I did not get to try. Some of these include anti-fog wipes and sprays, using random household items (raw potato, toothpaste, or shaving cream) on your lenses to prevent fogging. Before doing any of these, ensure that the special coatings on your glasses will not be affected!


    It does not sound like we will be out of masks anytime soon, so if you have fogging issues, give these methods a shot! Stay safe out there and wash your hands!


    Lindie Aragon is a Chemist for the City of Westminster’s Big Dry Creek Wastewater Treatment Facility.


  • 22 Nov 2020 4:32 PM | Natalie Love (Administrator)

    Before Covid-19 changed our lives as we know it, I personally had only been exposed to the world of wastewater-based epidemiology (WBE) through some conference presentations here and there. With the state-wide WBE work this year to monitor the levels of SARS-CoV-2 in the front range population, I thought it would be interesting to look at the different ways WBE is used to protect our communities.


    Collective drug use in a community

    WBE provides a way to look at drug use in areas, both licit and illicit, and has the benefit of avoiding surveys and the sampling bias that comes with general studies. Spatial snapshots of a location's wastewater help us to understand geographical trends in drug consumption. The European Monitoring Centre for Drugs and Drug Addiction analyzed the wastewater of 70 European cities in 2019 to discover geographical trends and patterns of cocaine, 3,4-Methyl​enedioxy​methamphetamine (also known as MDMA, Ecstasy, or Molly to name a few), amphetamine and methamphetamine. Data and findings can be found here.


    Analyzing WBE data over time gives us an idea of how drug use in a location is affected by outside factors. A study in the state of Washington looked to analyze the impact that legalization of cannabis had on the state's rate of usage. To evaluate cannabis use, the study measured wastewater concentrations of the byproduct of the active compound in cannabis. The wastewater pointed to a doubling in consumption over the 3-year period of testing. https://doi.org/10.1111/add.14641


    Population and Health Behavior

    Wastewater provides us with so much information about ourselves. A study in Australia during 2016 looked at wastewater for a range of diet, drug, pharmaceutical, and lifestyle biomarkers.   These markers were compared to the population's social, demographic, and economic properties. Some findings include higher use of the opioid-based pain reliever tramadol  in areas with more physical laborers. Higher antidepressant use and lower levels of dietary fiber were found in less educated areas. .  https://doi.org/10.1073/pnas.1910242116


    Virus monitoring/eradication

    WBE provides us with a way to monitor the spread and emergence of viruses in an environment. Polio is an example of a virus that can be closely monitored with a high-quality WBE surveillance system to avoid wild-type polio from spreading in areas. A study performed between 2010 and 2013 explains how two sewage plants in Japan monitored trace polioviruses and how this surveillance is key in controlling polio’s spread. https://doi.org/10.1128/aem.03575-14  


    WBE is being used worldwide to gather information to complement health agencies and epidemiologists in our fight against SARS-CoV-2. By providing a total account of increasing and decreasing levels of the virus, the potential for WBE to help with the current pandemic is promising. The water research foundation provides more information regarding the numerous efforts across the United States https://www.waterrf.org/. For more information about the Colorado Front Range WBE program, please reach out to CDPHE’s Communications Manager – MaryAnn Nason at maryann.nason@state.co.us.


    Danny McCausland is an Analyst II at the Metro Wastewater Reclamation District. He has 7 years experience working in the water quality field. 


    References

    Burgard, D. A., Williams, J., Westerman, D., Rushing, R., Carpenter, R., LaRock, A., Sadetsky, J., Clarke, J., Fryhle, H., Pellman, M., & Banta‐Green, C. J. (2019). Using wastewater‐based analysis to monitor the effects of legalized retail sales on cannabis consumption in Washington State, USA. Addiction, 114(9), 1582–1590. https://doi.org/10.1111/add.14641


    Choi, P. M., Tscharke, B., Samanipour, S., Hall, W. D., Gartner, C. E., Mueller, J. F., Thomas, K. V., & O’Brien, J. W. (2019). Social, demographic, and economic correlates of food and chemical consumption measured by wastewater-based epidemiology. Proceedings of the National Academy of Sciences, 116(43), 21864–21873. https://doi.org/10.1073/pnas.1910242116


    European Monitoring Centre for Drugs and Drug Addiction. (2020, March 12). Wastewater analysis and drugs: A European multi-city study. https://www.emcdda.europa.eu/system/files/publications/2757/POD_Wastewater%20analysis_update2020.pdf


    Nakamura, T., Hamasaki, M., Yoshitomi, H., Ishibashi, T., Yoshiyama, C., Maeda, E., Sera, N., & Yoshida, H. (2015). Environmental Surveillance of Poliovirus in Sewage Water around the Introduction Period for Inactivated Polio Vaccine in Japan. Applied and Environmental Microbiology, 81(5), 1859–1864. https://doi.org/10.1128/aem.03575-14


Powered by Wild Apricot Membership Software